
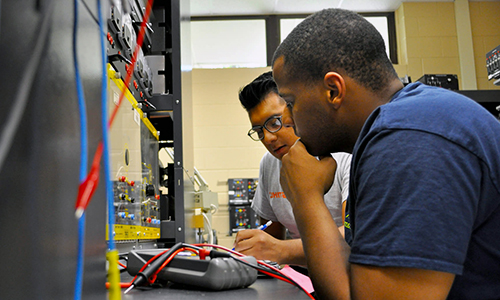
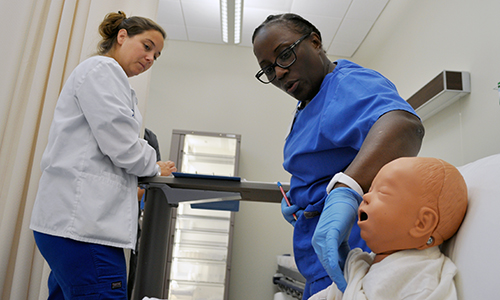


Student Achievement
Beaufort County Community College uses standards for student achievement that are based on performance measures adopted by the North Carolina Community College System (NCCCS) and College-defined student goals. NCCCS measures are published in an annual Performance Measures report. College-defined student goals include graduation rate, course completion, retention, and job placement.
Measure 1: NCCCS Performance Measures
| Basic Skills Progress | Credit English Success | Credit Math Success | First Year Progression | Curriculum Completion Rate | Licensure Pass Rate Index | Transfer Performance | |
| System Excellence |
1.216 | 1.174 | 1.204 | 1.063 | 1.094 | 1.073 | 1.031 |
| Average Band Max | 1.104 | 1.099 | 1.114 | 1.036 | 1.048 | 1.029 | 1.012 |
| System Mean |
0.992 | 1.025 | 1.024 | 1.009 | 1.002 | 0.985 | 0.993 |
| Average Band Min |
0.88 | 0.95 | 0.834 | 0.981 | 0.956 | 0.942 | 0.974 |
| System Baseline |
0.543 | 0.727 | 0.665 | 0.899 | 0.817 | 0.811 | 0.917 |
| BCCC |
1.038 | 1.004 | 1.243 | 1.074 | 0.924 | 0.972 | 1.025 |
On an annual basis, the North Carolina Community College System (NCCCS) evaluates each community college in North Carolina on seven established state and federal performance measures for individual student success that are appropriate to higher education. These measures are as follows:
- Basic Skills Student Progress
- Student Success Rate in College-level English Courses
- Student Success Rate in College-level Math Courses
- First-year Progression
- Curriculum Student Completion
- Licensure and Certificate Passing Rate
- College Transfer Performance
The NCCCS’ State and Federal Performance Measures report is published annually and includes system-wide baseline percentages (for both credit and non-credit coursework) for each area measured, as well as the average percentage across all colleges within the NCCCS. Colleges are rated for each performance indicator as follows:
- Met or exceeded the excellence level
- Above the college average, but below the excellence level
- Above the baseline level, but below the college average
- Below the baseline level
Threshold of Acceptability: The College defines the expected threshold of achievement for each of these performance measures to be “within the average band”. The rationale for this definition of achievement is to ensure uniformity across all measures and comparability to similar institutions within North Carolina.
Goal: The goal is to achieve “above average band” on each performance measure set by the NCCCS.
Outcome: Based on data in the 2023 Performance Measures report, as shown in the following table, the College achieved the threshold for acceptable performance in all categories except Curriculum Completion. Baseline levels are set two standard deviations below the system’s average index score and excellence levels are set one standard deviation above the system’s average index scores. The average band is within 0.5 standard deviations above or below the average index score.
The reports below are official reports released by the North Carolina Community College System. Each report details goals for student achievement and success of students in achieving those goals at Beaufort County Community College along with all other community colleges in North Carolina.
2024 Performance Measures Report
2023 Performance Measures Report
2022 Performance Measures Report
2021 Performance Measures Report
2020 Performance Measures Report
2019 Performance Measures Report
2017 Performance Measures Report
2016 Performance Measures Report
Measure 2: BCCC Graduation Rate
BCCC measures graduation rates based on a fall cohort of full-time, first-time degree/certificate-seeking undergraduate students. The completion status for this cohort of students is measured at 150% of the normal time to complete all requirements of their program of study. Full-time students are enrolled in 12 or more credit hours. First-time students are defined as students who have no prior post-secondary attending any institution for the first time at the undergraduate level. This group includes students enrolled in the fall term who attended college for the first time in the prior summer term, and students who entered with advanced standing (college credits or recognized postsecondary credential earned before graduation from high school). Degree seeking students are defined as students enrolled in courses for credit who are seeking a degree, certificate, or other recognized postsecondary credential.
Academic leadership including the Vice President of Academic Affairs, Dean of Instructional Effectiveness, Dean of Arts and Sciences, Dean of Business, Technology, and Public Services, and Director of Nursing and Allied Health created the definitions for baseline and goal rates in March 2021, using the outcomes of the 2015, 2016, and 2017 first-time, full-time cohorts. The decrease in cohort size from 2014 to 2016 is a reflection of BCCC's decision to no longer offer student loans. Utilizing running averages allows for ebbs and flows with student movement through BCCC.
Threshold of Acceptability: The threshold of accountability is calculated as the average graduation rate of the past three first-time, full-time cohorts. Using a running average allows for ebbs and flows with student movement through BCCC.
Goal: BCCC seeks continuous improvement of educational programs and services offered and set the graduation rate goal at 5% above the baseline or 3% above the last cohort’s rate, whichever is higher.
Outcome:
|
2020 cohort |
2019 cohort |
2018 cohort |
2017 cohort |
2016 cohort |
2015 cohort |
2014 cohort |
|
|
Total number of students in cohort |
80 |
80 |
81 |
75 |
87 |
120 |
146 |
|
Number of graduates within 150% time |
29 |
36 |
36 |
32 |
29 |
39 |
39 |
|
Graduation Rate |
36% |
45% |
44% |
43% |
33% |
33% |
27% |
|
Threshold of Acceptability |
44% |
40% |
36% |
||||
|
Goal |
49% |
47% |
46% |
Measure 3: Course Success Rates
Course success is defined as the percentage of students who complete the course with a "C" or better compared to the total number of students enrolled in a course.
Threshold of Acceptability: The threshold of achievement for course success is 70% across all modes of instruction to ensure our success rates do not fall below levels maintained over the last several years.
Goal: The goal is for at least 75% of students to achieve a C or better in courses across modalities, which is challenging yet attainable based on historical data.
Outcome:
| Mode of Instruction | 2018SP | 2018FA | 2019SP | 2019FA | 2020SP | 2020FA | 2021SP | 2021FA | 2022SP | 2022FA | 2023SP | 2023FA | 2024SP | 2024FA |
| Traditional | 81.25% | 87.49% | 80.95% | 79.84% | 76.51% | 78.12% | 80.80% | 75.12% | 84.43% | 83.67% | 74.93% | 82.65% | 86.17% | 86.60% |
| Hybrid/Blended | 83.05% | 77.42% | 75.74% | 77.60% | 74.33% | 78.03% | 76.67% | 68.31% | 71.92% | 75.93% | 76.90% | 76.20% | 82.14% | 79.38% |
| Distance Education | 73.02% | 69.64% | 74.54% | 68.43% | 73.18% | 71.60% | 71.70% | 65.99% | 67.20% | 68.43% | 72.40% | 70.23% | 74.85% | 74.18% |
| Total Student Body | 78.17% | 78.68% | 77.44% | 74.94% | 74.56% | 75.02% | 74.42% | 68.24% | 72.13% | 73.08% | 74.93% | 73.23% | 78.05% | 77.18% |
Measure 4: Student Retention Rates
Student retention is evaluated for students returning from fall-to-fall.
Threshold of Acceptability: Given the unique circumstances that students at Beaufort County Community College encounter with respect to employment, family responsibilities, etc., the College set the threshold of achievement for fall-to-fall retention at 60%.
Goal: The student retention goal is based on BCCC historical trend data and is set at 65%
Outcome:
|
Cohort |
Fall to Fall Retention |
|
Fall 2023 |
67.8% |
|
Fall 2022 |
64.80% |
|
Fall 2021 |
61.20% |
|
Fall 2020 |
65.00% |
|
Fall 2019 |
64.50% |
|
Fall 2018 |
62.00% |
|
Fall 2017 |
63.90% |
Measure 5: Job Placement
BCCC serves many curriculum students seeking to earn a credential to directly enter the workforce, making job placement an important student achievement measure. Job placement data for BCCC is obtained from North Carolina's Tool for Online Workforce and Education Reporting (NC Tower), an online tool using information from the Common Follow-up System to provide aggregate information on students who attended public universities, high schools, and community colleges in North Carolina.
Threshold of Acceptability: The threshold is that 75% of associate degree graduates for the academic year will be employed in North Carolina within one year of graduation. The rationale is based on previous data indicating that a significant percentage of our graduates continue their education after graduation.
Goal: The goal is for 80% of associate degree graduates for the academic year to be employed in North Carolina within one year of graduation, which we have not been able to consistently reach in past years.
Outcome: The following table of data from NC Tower demonstrates that the College achieved the acceptable level of performance for all years of available data. Data for 2021-2022 graduates is not yet available on NC Tower.
| Academic Years | 2014-2015 | 2015-2016 | 2016-2017 | 2017-2018 | 2018-2019 | 2019-2020 | 2020-2021 |
| Percent of graduates employed in North Carolina within one year of graduation | 84% | 78% | 78% | 80% | 78% | 80% | 81% |
Student Body Information
The link below provides statistical information about student body diversity, financial aid, college operation, and more at Beaufort County Community College. You can also do more research about the college using the National Center for Education Statistics (NCES) data base. The data is provided by BCCC through the college’s annual reporting requirement with the federal government.